Application monitoring from inside your app and from outside
Exceptions, requests, jobs and logs from inside your app; uptime, SSL, domain and link checks from a URL. With an API and MCP server for your coding agent.

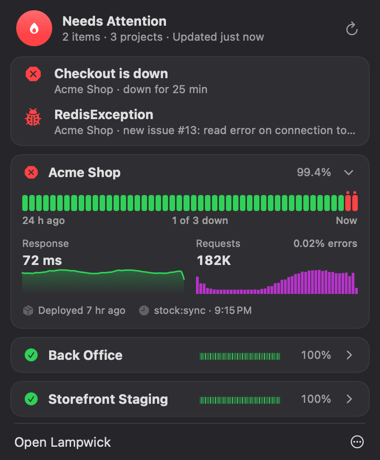
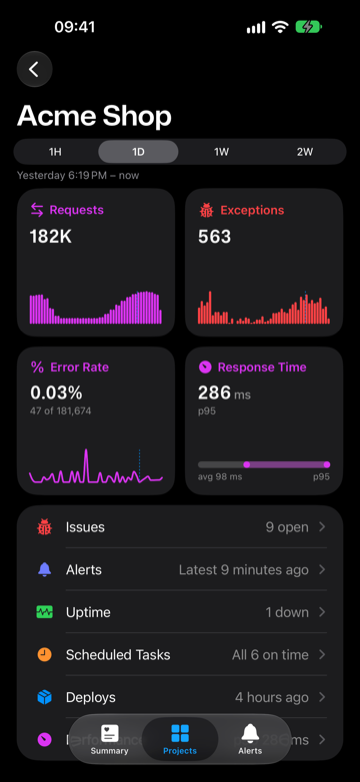
Example data. Open the demo
Issues. Exceptions grouped by class, file and line
A thousand identical exceptions are one issue with a count.
Stack trace and context
Each issue has the stack trace with source code, the users it hit, and the request or job it happened in, with its queries and logs.
Reopened when it comes back
A resolved issue reopens when the exception returns, and the team gets a push.
Deploys
Every deploy is a marker on the charts and lists the issues first seen after it.
Requests. Status codes, p95 and failures per route
The overview lists the slowest routes, so you see which one to fix first.
Timeline per request
Each request opens a timeline of what it did: its queries, outgoing calls, logs and exceptions.
Queries
Database queries grouped, with average and p95 duration, next to outgoing HTTP, cache, mail and notifications.
Jobs and scheduled tasks. Failed attempts and missed runs
Lampwick records every job attempt and every run of a scheduled task.
Jobs
Each job class with its processed, released and failed counts and p95 duration. A failed attempt shows the exception that stopped it.
Scheduled tasks
Lampwick learns each task's cron expression and timezone from its runs, and alerts when a task misses a run, starts failing or runs too long. There are no heartbeat URLs to create.
Schedule health needs the Laravel package today.
Logs. Every line with the request or job that wrote it
Filter by level and search the text.
In the timeline
A request or job shows its log lines between its queries and exceptions.
No alerts on log lines
Exceptions become issues, and issues alert. Log lines don't.
Uptime, SSL certificate and domain checks. From a URL
Paste a URL; your app needs no code. It works for sites you didn't build too.
Uptime
A request every 30 seconds to 1 hour, depending on the plan, from one location. After 2 failed checks in a row the team gets a down alert with the reason, such as
HTTP 503.SSL certificate
Read every 6 to 12 hours. Alerts 14, 7, 3 and 1 days before it expires, and at once when browsers would reject it.
Domain and DNS
The expiry date is looked up daily through RDAP, with alerts 30, 14, 7 and 1 days before. NS and MX records are checked hourly.
Broken links and mixed content. A daily crawl of up to 250 pages
Lampwick follows the links of your site once a day and checks every one, external links too.
Broken links
5xx, 404, other 4xx and connection errors, grouped, with the pages each link is on.
Mixed content
http://images, scripts, stylesheets and iframes onhttpspages.One alert per crawl, for new findings
Such as "12 broken links (2 new) on 183 pages". Links you know about can be ignored.
From Pro. The crawl reads HTML and doesn't run JavaScript.
Status pages. Live status, daily uptime and incident notices
A public page at app.lampwick.dev/status/your-name with the monitors you pick.
Overall status
Worked out from the monitors and your notices, such as All systems operational or Partial outage.
Daily uptime
A bar per day for each monitor, up to 90 days, under a public name you choose.
Incident and maintenance notices
A team owner posts them by hand. Closed notices stay visible for 14 days.
From Pro, up to 10 pages per team. No custom domain.
Alerts. By push, email, Slack, Discord, Microsoft Teams or webhook
Every member of a project's team gets alerts by push in the iOS app and by email. There is nothing to set up.
What alerts
A monitor down and up again, a certificate or domain about to expire, changed DNS records, new broken links, and scheduled tasks that missed, failed or ran slow.
Alert channels
A team's alerts and its new and reopened issues, in Slack, Discord, Microsoft Teams or on your own signed webhook.
Mute
Per monitor, task or account. A site that goes up and down sends at most one down alert per 30 minutes.
New issues go to push and alert channels, not email. No SMS, phone calls or PagerDuty.
MCP server and API. Your coding agent reads issues, requests, logs and monitors
They are in the API and on an MCP server at /mcp, read-only unless you choose otherwise.
Ask from your repository
"Show me the stack trace of #209 and the request it happened in. Propose a fix." The agent proposes a change and you review it.
Set up by your agent
A coding agent can create a trial workspace without an account and connect your app. You claim it with one link.
Product analytics. Also included, from the same requests
When your requests carry the signed-in user, Lampwick counts active users, retention and funnels from them, and shows how many users an issue hit. There is no tracking script to add.
Connect. With OpenTelemetry, the Laravel package or an HTTP POST
OpenTelemetry for Node.js, Next.js and Python, a package for Laravel, or a POST from anything else.